General guidelines
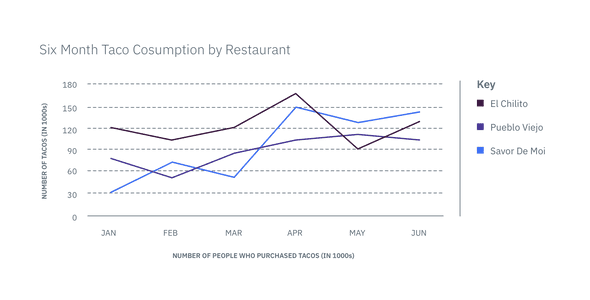
Line graphs connect individual data values together to show the continuity from one value to the next, making it a great way to display the shape of values as they change over time. When displaying a time-series, always place time on the x-axis so it reads chronologically from left to right.
