Refer to the style tab on the Data Vis overview page for base graph style specifications.
Color
| Color | Opacity |
|---|---|
| Main | 100% |
| Hover | 50% of the main data representation color |
Structure
| Property | px | rem |
|---|---|---|
| Height & width | 8 | 0.5 |
| Hover height & width | 20 | 1.25 |
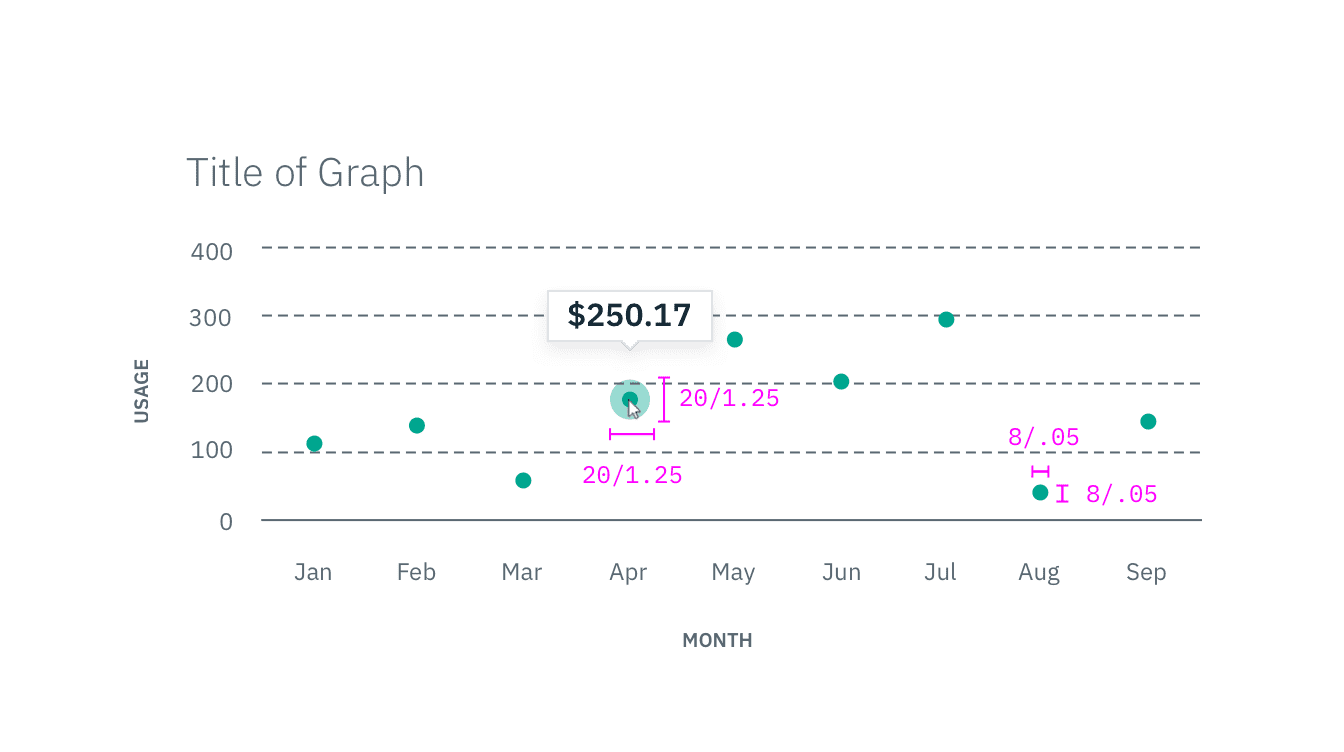 Example of a Scatter Plot